 mb_qvxjmcan
同问!
[em_006]
mb_qvxjmcan
同问!
[em_006]
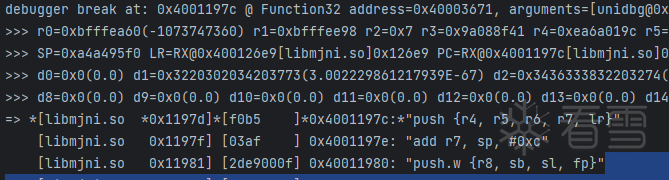
c: continue
n: step over
bt: back trace
st hex: search stack
shw hex: search writable heap
shr hex: search readable heap
shx hex: search executable heap
nb: break at next block
s|si: step into
s[decimal]: execute specified amount instruction
s(bl): execute util BL mnemonic, low performance
m(op) [size]: show memory, default size is 0x70, size may hex or decimal
mx0-mx28, mfp, mip, msp [size]: show memory of specified register
m(address) [size]: show memory of specified address, address must start with 0x
wx0-wx28, wfp, wip, wsp <value>: write specified register
wb(address), ws(address), wi(address), wl(address) <value>: write (byte, short, integer, long) memory of specified address, address must start with 0x
wx(address) <hex>: write bytes to memory at specified address, address must start with 0x
b(address): add temporarily breakpoint, address must start with 0x, can be module offset
b: add breakpoint of register PC
r: remove breakpoint of register PC
blr: add temporarily breakpoint of register LR
p (assembly): patch assembly at PC address
where: show java stack trace
trace [begin end]: Set trace instructions
traceRead [begin end]: Set trace memory read
traceWrite [begin end]: Set trace memory write
vm: view loaded modules
vbs: view breakpoints
d|dis: show disassemble
d(0x): show disassemble at specify address
stop: stop emulation
run [arg]: run test
gc: Run System.gc()
threads: show thread list
cc (size): convert asm from (0x121657bc) to (0x121657bc + size) bytes to c function
当作命令行,往上面输入就可以了,你按回车就能看到这些